
It can be hard to get a handle on your expenditures and trim the fat, so to speak, if you don't know how much is going
out. You can start by listing all your recurring expenses.
It is very helpful to use a spreadsheet to do this since
it is much easier to run some simple statistics and make some graphs when you have the information digitally rather
than a pile of bills and receipts!
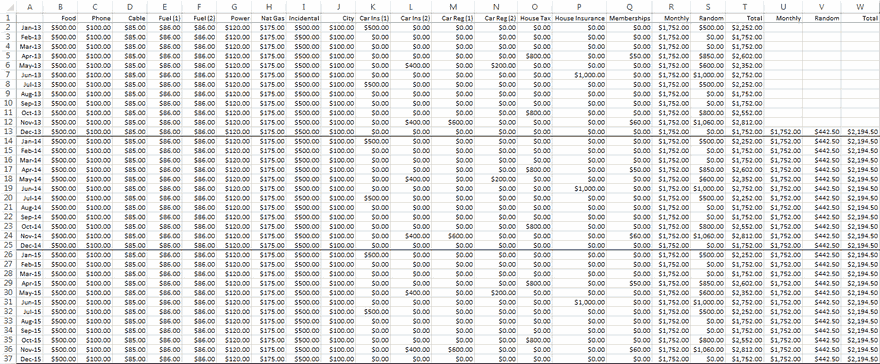
Create a spreadsheet with each month in Column A. Across the top row place headers indicating each of your monthly
or once-a-year (or twice-a-year) expenses. See below for an example spreadsheet with some random values filled in
for expenses.
Think about what you spend money on and make a column for each. Go back and look at previous utility
bills to fill in historical values. Some items you might include are:
Next, add up the monthly and the random expenses into their own columns. For example, if columns B thru J are monthly
and columns K thru Q are expenses that happen only at various times in the year, then, in column R you will want the
sum of columns B thru J and in S the sum of columns K thru Q. Row 1 is your header row with the information indicating
what is in each column. In Cell R2, type =sum(b2:j2) and in S2 type =sum(k2:q2). These two formulas
will add up your monthly and your random expenses for the first row of values. In column T, type =(r2+s2)
You can then copy and paste these three cells down the column so that you get totals for each of your months.
Since expenses vary over the year, it is good to look at the average over a period of 12 months. If you look at
a series of 12 month averages, you can see if there are trends in your spending, are you spending more as time goes
by or less? This will help you see if your spending habits are becoming more conservative. If your record of
purchases starts in January 2013, in December of 2013 you would have a full 12 months of data. So, now, in Cell U13
you could use the formula =average(r2:r13) (assuming that column R holds your monthly totals). Similarly, in
Cell V13 you could use the formula =average(s2:s13) to get an average of your random spending over the last 12
months. Finally, Cell W13 would contain the formula =u13+v13 to obtain the 12-month average of all your
expenses (both the monthly and random ones over the course of a year).
Now, if you copy those three cells down to the rest of the rows, you can see what your moving 12-month average
spending is. So, Cell U14 would be the average of the monthly expenses from February 2013 thru January 2014, Cell
U15 would be the average of the monthly expenses from March 2013 thru February 2014, etc.
Fill in the values for each expense as it occurs and after some time you'll be able to determine an average monthly
value that you can use for future occurences. From this you can see how much you'll be needing each month and as
you trim your spending you can see the effect. The spreadsheet above shows some general (random actually) values used
for each category, yours will obviously be different.
Making a Budget
You may have others or some of the above may not apply. Keep the items that are recurring monthly expenses in adjacent
columns and keep items that occur randomly through the year in another set of adjacent columns. Examples of random expenses
might be memberships, car registration, house taxes, house insurance, etc.
